Overview
To support and advice local apple and wine farmers in their daily decisions and activities, the "Südtiroler Beratungsring für Obst- und Weinbau" (SBR) collects various weather parameters from more than 130 weather stations that are distributed in South Tyrol's vineyards and orchards. Based on the analysis of this meteorological data, the SBR sends warnings about potential threats (e.g., apple scab, fire blight, frost protection) and messages about recommended activities to the farmers.
The aim of this research project is to develop tools to support the monitoring and analysis of meteorological time series data. More specifically, we will focus on the design, implementation, and evaluation of algorithmic solutions for
- the imputation of missing values and
- the search for similar patterns in meteorological time series data.
The project is done in collaboration with the SBR, the Laimburg Research Centre for Agriculture and Forestry, and the University of Zurich.
 Imputation of missing values in time series: There are
many reasons for missing values, e.g., broken or malfunctioning
sensors or problems with the transmission of the data. If this
happens, the missing values need to be interpolated as many analysis
tools require complete data. Currently, a expert at the SBR
interpolates missing values based on the values measured at nearby
stations.
Imputation of missing values in time series: There are
many reasons for missing values, e.g., broken or malfunctioning
sensors or problems with the transmission of the data. If this
happens, the missing values need to be interpolated as many analysis
tools require complete data. Currently, a expert at the SBR
interpolates missing values based on the values measured at nearby
stations.
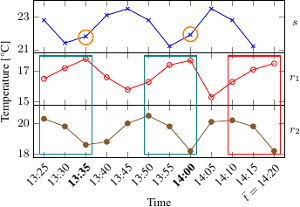
We investigate how to compute missing values in one time series from the values of other time series (recorded at other stations). The basic idea of our approach is to continuously keep for each station a list of the most similar ones among the other stations. When a station fails, the top-K most similar stations are used to interpolate the missing values. There are a number of problems and challenges due to some inherent characteristics of the data. Firstly, the most similar stations are not necessarily the geographically closest ones, although this might frequently be the case. Secondly, the most similar stations typically change over time. For example, the temperature changes quickly (within a few minutes) several degrees at sunrise or sunset, which is typically different for different stations. Thirdly, there are approximately 20 different parameters that are recorded. All of them have different characteristics.
 Similarity search in time series: Searching for similar
situations in historical data is one of the most basic analysis
tasks in time series data. Examples in our application domain
include the following: When were the conditions for scab infection
similar to the past three days? When did we have an average
temperature of 13C in combination with high leaf wetness in July?
Find the most similar periods in the past two years to this week's
weather. These and similar questions require to compare time series
data and to seek similar historical data for specific patterns,
where the matching between the query pattern and the data is
approximate rather than precise.
Similarity search in time series: Searching for similar
situations in historical data is one of the most basic analysis
tasks in time series data. Examples in our application domain
include the following: When were the conditions for scab infection
similar to the past three days? When did we have an average
temperature of 13C in combination with high leaf wetness in July?
Find the most similar periods in the past two years to this week's
weather. These and similar questions require to compare time series
data and to seek similar historical data for specific patterns,
where the matching between the query pattern and the data is
approximate rather than precise.
Most of the previous work on similarity search in time series data concentrates on working with single time series, whereas in our application we have usually to compare several time series in parallel. For instance, the most similar week is characterized by several time series (temperature, humidity, wind speed, etc.). Therefore, we need to define similarity measures between sets of time series, where the time series might have different characteristics and ranges. After having defined appropriate similarity measures, we will study and develop efficient algorithms to compute such similarity measures and to answer pattern matching queries. The efficiency is particularly critical since we need to analyze many time series in parallel.
